Graphics Interpretation: READ the Axes First

You click to the next Integrated Reasoning question. There's a bar chart. One bar towers over the rest. Before you've read a single word, your eyes are already parked on top of it, and your brain has already decided: that's the biggest one, so that's the answer.
I'll bet you've done this. I'll bet you did it last week. And on Graphics Interpretation, that tall bar is EXACTLY where the trap sits.
Here's the fix: read the axes first. Every time. Before the bars, before the sentences, before anything else. Let me show you why.
What you're actually facing
Integrated Reasoning is one of the three sections on the Executive Assessment. It's 30 minutes and 12 questions, it's scored from 0 to 20, and it counts just as much toward your total as Verbal and Quant do. You can see the full layout on GMAC's assessment structure page. If you've been treating this section as a throwaway, read why Integrated Reasoning is NOT the warm-up act.
Graphics Interpretation is one of the question types in that section. You get a graph (a bar chart, a line graph, a scatterplot, a pie chart) and one or two sentences with blanks in them. Each blank is a drop-down menu. Your job is to pick the option that makes each sentence true.
Notice what that means. The graph is not the question. The sentences are the question, and the axes tell you what the graph can and cannot say about them.
Stop reading for a second. When you look at a graph, what's the FIRST thing you read? Be honest. If your answer is "the bars" or "the highest point," keep going, because this post is about you.

The order that works
This takes about 15 seconds once you've trained it. Do it in this order:
- The title. What is this graph about? Revenue? Change in revenue? Those are NOT the same thing.
- The vertical axis. What does it measure, in what units, and where does it start? Zero? Something else? Can it go negative?
- The horizontal axis. What's being compared: years, regions, products?
- The legend and any notes. Is there a second axis on the right? Is there a footnote like "in thousands"?
- The sentences. Now read what you're being asked.
- The data. Only now do you look at the bars.
And write it down. One short line on your notepad, something like "% change vs prev quarter, can go below 0." Those few words are what keep you from solving the wrong problem.
Try it
Now be honest with yourself. If you had looked at the axis first and written "% change" on your pad, would you have fallen for either trap? I doubt it. That's the whole point. The math here is easy. The READING is what gets people.
The mistakes I watch people make every week
- Treating every vertical axis as "how much." People assume the taller the bar, the more of the thing. But axes can measure change, rates, shares or rankings. INSTEAD: name the measure in a few words on your pad before you look at a single bar.
- Missing the units. Say the axis is labeled "sales (in thousands)." The bar reads 40. Somebody picks 40 from the drop-down when the right option was 40,000. INSTEAD: hunt for the words "in thousands," "in millions" or "%" in the axis label and the footnotes. Write the units next to your note.
- Trusting the shape when the axis doesn't start at zero. If the axis starts at 80, a bar reaching 90 looks twice as tall as a bar reaching 85, even though 90 is only a little bigger than 85. Your eyes lie to you here. INSTEAD: check where the axis starts. If it isn't zero, ignore how the bars look and do the subtraction or division on paper.
- Reading the wrong axis on a two-axis chart. Some graphs put bars on the left axis and a line on the right axis, with different units. People read the line against the left side and get garbage. INSTEAD: check the legend, then write "bars = left, line = right" (or whatever it is) on your pad.
- Doing it all in your head. "I'll just remember it's percent change." No, you won't, not 25 minutes into a timed section when you're tired. That's pride talking. INSTEAD: take the notes. Every time. In practice AND on test day.
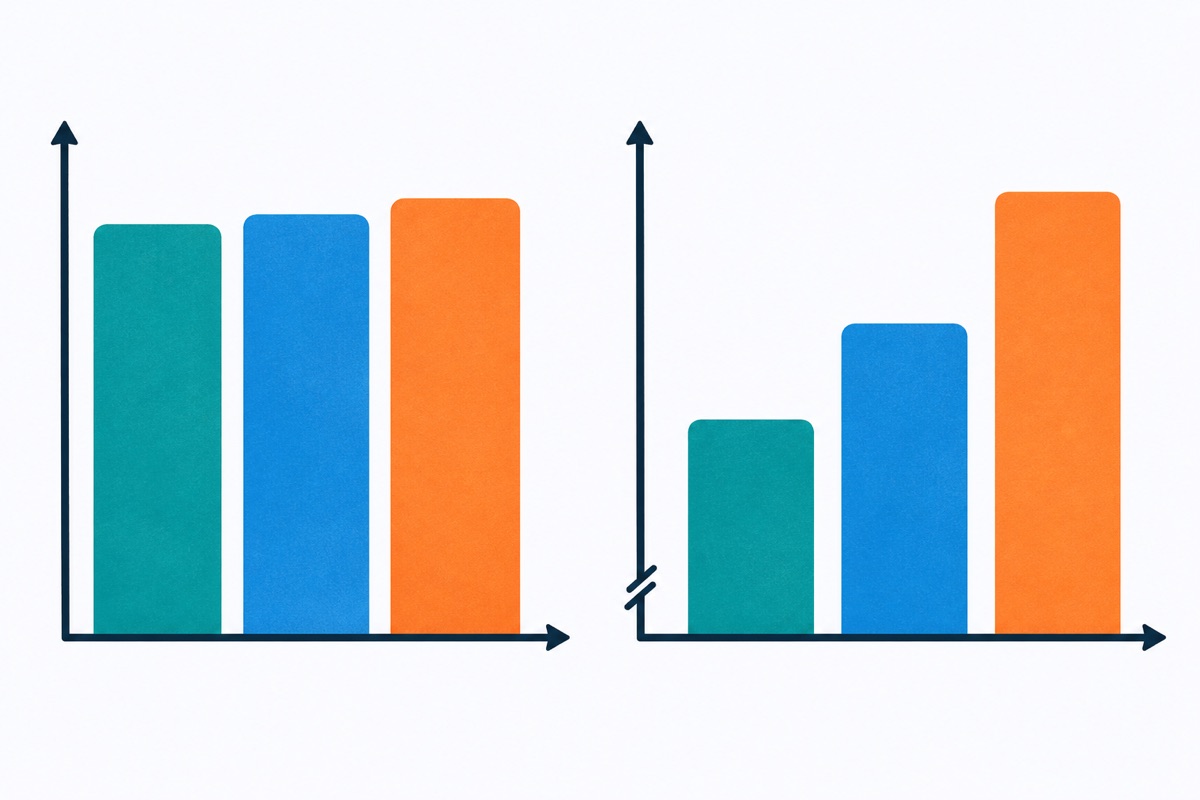
"But I don't have time to read the axes"
Yes, you do. Do the math: 30 minutes for 12 questions is two and a half minutes per question, on average. Spending 15 seconds on the axes costs you almost nothing. Spending two minutes solving the wrong problem costs you the whole question AND the time.
So decide what you want MORE: to feel fast for the first ten seconds of a question, or to actually get it right?
This is the same disease I see on other parts of this section. People either rush past the setup or drown in it. Read the frame that tells you what the data means, then go get only the data you need. It's the same idea behind not reading Multi-Source Reasoning tabs like a novel. Train the order until it's automatic, and the "time problem" mostly disappears, because it was never really a time problem. It was a reading problem that showed up on the clock.
Your assignment for today
Find five graphs. Practice questions, the business section of a news site, a report from work, it doesn't matter. For each one, BEFORE you look at the data, write one line: what the vertical axis measures, its units and where it starts.
Then, for each graph, write one claim that the tallest bar or highest point does NOT prove. If you can't come up with one, you haven't read the axes closely enough yet. Go back and read them again.
Five graphs. Ten minutes. Do it today, not after you finish reading three more blog posts.